“Each year, we’ll release a straightforward report that allows you to hold us accountable for our actions, while we navigate the challenges of sustainability as a small business.”
When we wrote those words, it was at the end of a year and a half of planning prior to the launch of Scenery. Not full-time - evenings slotted around our full-time jobs, week by week, defining our concepts and ideas. We have partnered with an incredible venue - the Jerwood Space in Southwark, which is shortly to be the permanent physical home of Scenery, having soft-launched the cafe in October 24’ and as of March, the roastery.
We launched Scenery perhaps 6 months earlier than would have been ideal - we were eager to get the company going, to tender for the space, as well as to secure the ability to slot roast on a Loring, our preferred roaster of choice.
We talked about many of our longer-term goals and visions in the run-up to launch - but so, so many of them required a physical space to actualise. In many ways, we’ve been fortunate to have had such a warm reception from the industry and coffee lovers across the UK (and a few international friends too) in our nascent times. In other ways the nature of being a nomadic roaster has slowed the deployment of our longer-term goals.
“While we navigate the challenges [...] [of] a small business” would have perhaps been the better line - for the 3 founders, this is our first time starting a business rather than working within an established brand with the resources that afford. We’ve worked second jobs, overworked ourselves at times, and tried to bootstrap as much of this business in-house as possible.
We spent a good chunk of time last year working on our first transparency report. The goal was to tackle something that's always bothered us about coffee transparency reports - they tend to share lots of pricing data about producers and exporters, but very little about the roasters themselves. It feels wrong to publish commercially sensitive information about our supply chain partners without their explicit consent, while keeping our own numbers under wraps.
So we tried something different - using the Specialty Coffee Transaction Guide as a benchmark to show where our purchases sat compared to global medians, without exposing anyone's specific pricing. Turns out comparing everything against aggregated data sets while accounting for lot sizes, origins, and quality levels is... complex. Really complex. About as far from profoundly straightforward as you could imagine.
By the time we'd finished wrestling with the data, writing it all up in a way that explained the complex methodology, then punching it up to look nice - we were looking at releasing a report in 2025 about coffee we bought in 2023. With coffee prices going absolutely wild throughout 2024, those numbers started feeling less like useful insights and more like ancient history. We also spotted some holes in how we were measuring things that we'd want to fix before doing this again.
So rather than push out a report that's more interesting as a historical document than a useful tool for accountability, we're taking what we learned and building it into something better in time for the 2025/26 Speciality Price Transaction Guide report. By then we'll have nearly 3 years of data to draw year on year comparisons, which was always the goal for measuring impact and relationship strength.
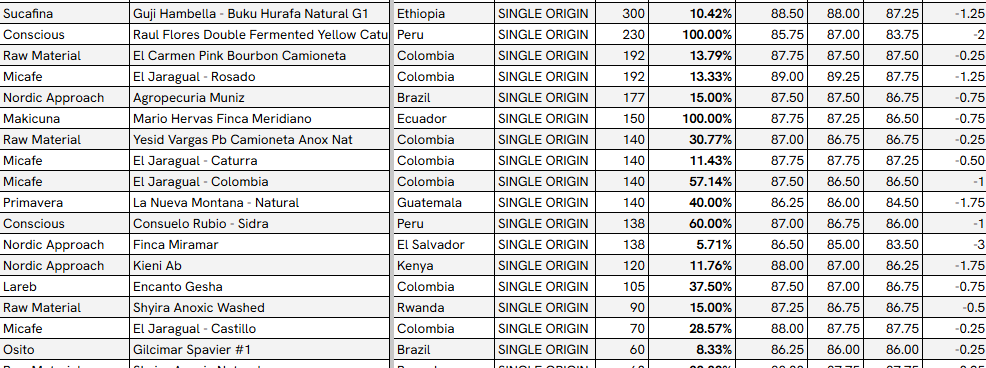
Here are the headline figures for 2023:
Production Summary
| Roasted | 3,333 kg |
| Batches | 293 |
| Green Inventory Used | 3,876 kg |
| Unique Lots | 19 |
| Category | Green Coffee | No. of Lots |
|---|---|---|
| Colourful | 111.63* | 3 |
| Decaf | 193.2 | 2 |
| Facility | 2387.3 | 6 |
| Single Origins | 1163.76 | 8 |
| Top Single Origin |
336 |
Guatemala -Paya by Nery Pablo |
| Second Place | 253.5* | Ethiopia - Buku Hurufa |
*Buku Hurufa ran as both a colourful component and as a single origin, and the data is mixed
Here are the headline figures for 2024:
Production Summary
| Roasted | 18,286 kg |
| Batches | 1,194 |
| Increase vs. Previous Period | +448.57% |
| Green Inventory Used | 21,105 kg |
| Category | Green (kg) | No. of Lots | Green Diff (%) | No Lots Diff (%) |
|---|---|---|---|---|
| Colourful | 872.91 | 8 | 564.67% | 166.67% |
| Decaf | 1042.10 | 6 | 439.39% | 200.00% |
| Facility | 13478.20 | 12 | 464.58% | 100.00% |
| Single Origins | 5715.45 | 44 | 391.12% | 450.00% |
| Top Single Origin | 480.00 | Mexico - Electrónicas Mazateca | - | - |
| Second Place | 420.00 | Brazil - Gilcimar Spavier | 150% increase on first purchase* | - |
*Purchased to use as a house filter, we had to move some of Gilcimar's coffee to Facility to keep up with our schedule.
What next?
At times this journey has been anything but straightforward, but looking at the numbers, it's clear how far we've come. From an early launch that forced us to learn fast, to finding a permanent home, to refining how we measure and communicate transparency—each step has shaped Scenery into what it is today.
We set out with the intention of accountability, and while we flubbed our first transparency report (mainly through hubris & lofty ambitions), what we’ve learnt in the process has already influenced our decisions and growth, and should stand us far better in the long run. By next year, we’ll have a clearer, more meaningful dataset that reflects our growth, our sourcing philosophy, and the relationships we’re building.
The last two years have been intense, but the progress speaks for itself. We’ve scaled production sixfold, expanded our sourcing, and established the foundations for everything we set out to do. With a permanent roastery and a slightly better handle on what we’re doing, we’re in a more stable place to keep moving forward.
There’s still plenty to figure out (and probably a few things we’ll get wrong along the way), but at least now we have a foundation to build on.